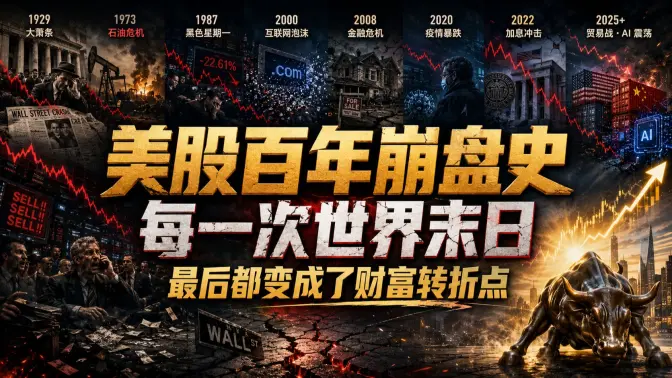
Every Apocalypse Eventually Becomes a Turning Point for Wealth
Market crashes are often preceded by periods of excessive optimism and leverage.
OPEN SOURCEMarket crashes are often preceded by periods of excessive optimism and leverage.
Each crash leads to significant economic and financial repercussions, affecting investor confidence and market structure.
Recovery from crashes varies, with some markets rebounding quickly while others take years.
Lessons from past crashes emphasize the importance of understanding market dynamics and maintaining a long-term perspective.
Investors must differentiate between short-term price fluctuations and long-term value.
- Identify recurring themes in market crashes
- Highlight the role of investor psychology in market dynamics
- Demonstrate the markets ability to recover from downturns
- Showcase the importance of long-term investment strategies
- Acknowledge the complexity of market behavior during crises
- Recognize the interplay between policy responses and market recovery
- The U.S. stock market has experienced numerous crises that often incite panic, with each downturn raising doubts about the possibility of recovery
- Market declines usually follow extended periods of optimism, where investors expect continuous growth, only to be jolted by unexpected events that undermine confidence
- The panic of 1907 exposed the vulnerabilities of the financial system, leading to the creation of the Federal Reserve to enhance banking stability
- The 1929 stock market crash not only resulted in a drastic fall in stock prices but also initiated a widespread economic downturn, demonstrating the interconnectedness of financial systems
- Recoveries from market crashes can span decades, as evidenced by the aftermath of the 1929 crash, which saw the market return to its previous highs only by 1954, significantly affecting investor sentiment
- The 1973 market crash illustrated that economic crises can stem from broader systemic shifts rather than just isolated market bubbles
details
details
- Post-World War II economic growth in the U.S. faced challenges by the late 1960s, leading to a market downturn driven by rising inflation and interest rates
- The 1973-1974 market crash saw a gradual erosion of investor confidence, contrasting with the sudden collapse of 1929, affecting both stocks and bonds
- The 1987 stock market crash, known as Black Monday, resulted in a record single-day drop of 22.6% in the Dow Jones Industrial Average, influenced by high valuations and emerging algorithmic trading strategies
- Despite the severity of the 1987 crash, recovery was swift due to the absence of a banking crisis and improvements in market mechanisms, illustrating the difference between stock market declines and broader economic down
- These crises highlight the importance of understanding market dynamics, particularly the effects of interest rates and the potential for liquidity to disappear during extreme market conditions
details
- The late 1990s tech bubble demonstrated how excessive investor enthusiasm for internet companies inflated valuations, leading to a market correction by 2002 as many firms lacked profitability
- The 2008 financial crisis exposed the risks of over-leveraged assets and the false sense of security surrounding mortgage-backed securities, resulting in a systemic credit crisis as trust in financial institutions dimini
- The COVID-19 pandemic caused a rapid economic downturn in early 2020, leading to a swift market crash driven by fears of halted economic activity rather than just declines in individual company performance
- Each crisis, from the tech bubble to the financial meltdown and the pandemic, emphasizes the need to differentiate between true value and speculative hype, highlighting the essential role of trust in the financial system
details
details
details
- During the pandemic, the market faced significant volatility, prompting widespread sell-offs as investors favored cash over potential returns
- Policymakers responded rapidly with aggressive interest rate cuts and large-scale asset purchases, which restored liquidity and facilitated a swift recovery in stock prices by August 2020
- The influx of monetary stimulus raised concerns about future inflation and interest rate hikes, negatively affecting high-growth and tech stocks as the market adjusted
- By 2025, new tariffs introduced uncertainty in trade policies, raising fears of increased business costs and potential inflation, complicating the economic landscape
- The recovery from market crises illustrates a complex interplay of policy responses, investor sentiment, and external shocks, underscoring the importance of understanding economic fundamentals and geopolitical factors
details
details
details
- Market crashes typically follow extended periods of prosperity, revealing systemic vulnerabilities, as evidenced by historical events from 1907 to 2020
- Post-crash recovery does not ensure that all companies will bounce back; some may fail or be permanently revalued, highlighting the need for resilient asset management
- Investor panic is a natural market phenomenon; successful investors focus on long-term value rather than being swayed by short-term price changes
- The VIX index is a key measure of market fear, with elevated levels potentially indicating buying opportunities, though investors should assess the strength of underlying assets
- Market crises often prompt a reassessment of asset prices; while short-term volatility can be unsettling, long-term investors should keep a broader perspective on market cycles and recovery potential
This analysis is an original interpretation prepared by Art Argentum based on the transcript of the source video. The original video content remains the property of the respective YouTube channel. Art Argentum is not responsible for the accuracy or intent of the original material.